Laravel Debugbar: The Ultimate Debugging Tool for Laravel Developers
Debugging is an essential part of web development, and Laravel provides a powerful debugging tool called Laravel Debugbar, developed by Barry vd. Heuvel (Barryvdh). This PHP debugging package offers real-time debugging information, making it easier to identify performance bottlenecks, slow database queries, route information, and memory usage issues.
In this comprehensive guide, we'll explore Laravel Debugbar for Laravel 10 and Laravel 11, covering installation, configuration, advanced features, and best practices to help you optimize your Laravel applications and improve development efficiency.
What is Laravel Debugbar? Understanding the PHP Debugging Powerhouse
Laravel Debugbar is an open-source debugging and profiling package that seamlessly integrates with Laravel applications (compatible with Laravel 8, 9, 10, 11, 12, 13). It provides a comprehensive debugging toolbar that displays crucial development information without interrupting your workflow.
This Laravel debugging tool helps developers track and analyze:
- ✅ SQL queries and database performance
- ✅ Request and response data
- ✅ Exceptions and errors with stack traces
- ✅ Blade view templates and rendering time
- ✅ Timeline and performance metrics
- ✅ Route information and middleware
- ✅ AJAX and API requests history
- ✅ Mail sent and HTTP client requests
- ✅ Memory usage and PHP version info
- ✅ Session and authentication data
💡 Pro Tip:
Laravel Debugbar is based on the PHP Debug Bar and specifically adapted for Laravel's ecosystem, making it the most popular debugging solution for Laravel developers with over 16,000 stars on GitHub.
Installing Laravel Debugbar: Step-by-Step Setup Guide
Prerequisites
Before installing Laravel Debugbar, ensure you have:
- PHP 7.4 or higher (PHP 8.1+ recommended)
- Laravel 8.x, 9.x, 10.x, 11.x, 12.x, 13.x
- Composer package manager
Installation via Composer
Install Laravel Debugbar as a development dependency using Composer. The --dev flag ensures it's only installed in development environments:
composer require barryvdh/laravel-debugbar --devPublish Configuration (Optional)
To customize Debugbar settings, publish the configuration file to config/debugbar.php:
php artisan vendor:publish --provider="Barryvdh\Debugbar\ServiceProvider"Environment Configuration
Add these settings to your .env file for better control:
# Enable/Disable Debugbar
DEBUGBAR_ENABLED=true

# Application must be in debug mode
APP_DEBUG=true

# Optional: Control specific collectors
DEBUGBAR_CAPTURE_AJAX=true
⚠️ Important Security Note:
Never enable Debugbar in production environments as it exposes sensitive application data including database queries, environment variables, and configuration details.
Key Features of Laravel Debugbar: Master Every Debugging Tool
1. Timeline & Performance Monitoring: Identify Bottlenecks
The Timeline tab visualizes your application's execution flow, showing exactly where time is spent. Use custom measurements to profile specific operations:
use Debugbar;

// Start and stop measuring
Debugbar::startMeasure('render', 'Time for rendering');
// ... your code here
Debugbar::stopMeasure('render');

// Add a measure from start to now
Debugbar::addMeasure('now', LARAVEL_START, microtime(true));

// Measure a closure execution
Debugbar::measure('My long operation', function() {
    // Perform complex calculation
    sleep(2);
    return User::with('posts')->get();
});

// Info messages for debugging
Debugbar::info('User loaded successfully');
Debugbar::warning('Cache miss detected');
Debugbar::error('API request failed');
✨ Performance Tip:
Operations taking longer than 500ms will be highlighted in red, making it easy to spot performance issues that need optimization.
2. SQL Query Debugging: Optimize Database Performance
The Queries tab is one of Debugbar's most powerful features, showing every database query with execution time, bindings, and duplicate detection. This helps identify:
- N+1 query problems - repeated queries in loops
- Slow queries needing indexing or optimization
- Unnecessary queries that can be removed
- Missing eager loading opportunities
use Illuminate\Support\Facades\DB;

// Enable query logging manually
DB::enableQueryLog();

// Execute your queries
$users = User::all(); // Without eager loading - BAD!
foreach ($users as $user) {
    echo $user->posts->count(); // N+1 problem!
}

// View query log in Debugbar
Debugbar::info(DB::getQueryLog());

// OPTIMIZED VERSION with eager loading
$users = User::with('posts')->get(); // Only 2 queries instead of N+1!
foreach ($users as $user) {
    echo $user->posts->count();
}

// Advanced: Measure specific query performance
Debugbar::measure('Load users with posts', function() use ($userId) {
    return User::with(['posts' => function($query) {
        $query->where('status', 'published')
              ->orderBy('created_at', 'desc');
    }])->find($userId);
});
3. Exception Handling: Catch and Log Errors Effectively
Track exceptions without breaking application flow. Perfect for debugging error-prone sections:
use Debugbar;

try {
    // Risky operation
    $result = ExternalAPI::call();

    if (!$result->success) {
        throw new \Exception('API call failed: ' . $result->message);
    }

} catch (\Exception $e) {
    // Log exception to Debugbar without stopping execution
    Debugbar::addException($e);

    // Add context information
    Debugbar::error('API Error: ' . $e->getMessage());
    Debugbar::info('Attempted URL: ' . $result->url ?? 'N/A');

    // Return fallback data
    $result = Cache::get('api_fallback');
}

// Multiple exception handling
try {
    Payment::process($order);
} catch (\Stripe\Exception\CardException $e) {
    Debugbar::addException($e);
    Debugbar::warning('Card declined: ' . $e->getMessage());
} catch (\Exception $e) {
    Debugbar::addException($e);
    Debugbar::error('Payment processing error');
}
4. View Debugging: Monitor Blade Templates & Data
The Views tab displays all rendered templates, showing:
- Which Blade templates were loaded
- Data passed to each view
- View rendering time
- View composers and nested views
This helps ensure you're not passing unnecessary data to views, improving performance:
// BAD: Passing entire models with relations
return view('dashboard', [
    'user' => User::with('posts', 'comments', 'profile')->find($id)
]);

// GOOD: Only pass required data
return view('dashboard', [
    'userName' => $user->name,
    'postCount' => $user->posts()->count(),
    'recentPosts' => $user->posts()->latest()->take(5)->get(['id', 'title'])
]);

// Check in Debugbar's Views tab to see exactly what data was sent
5. Route Information: Inspect Current Request Details
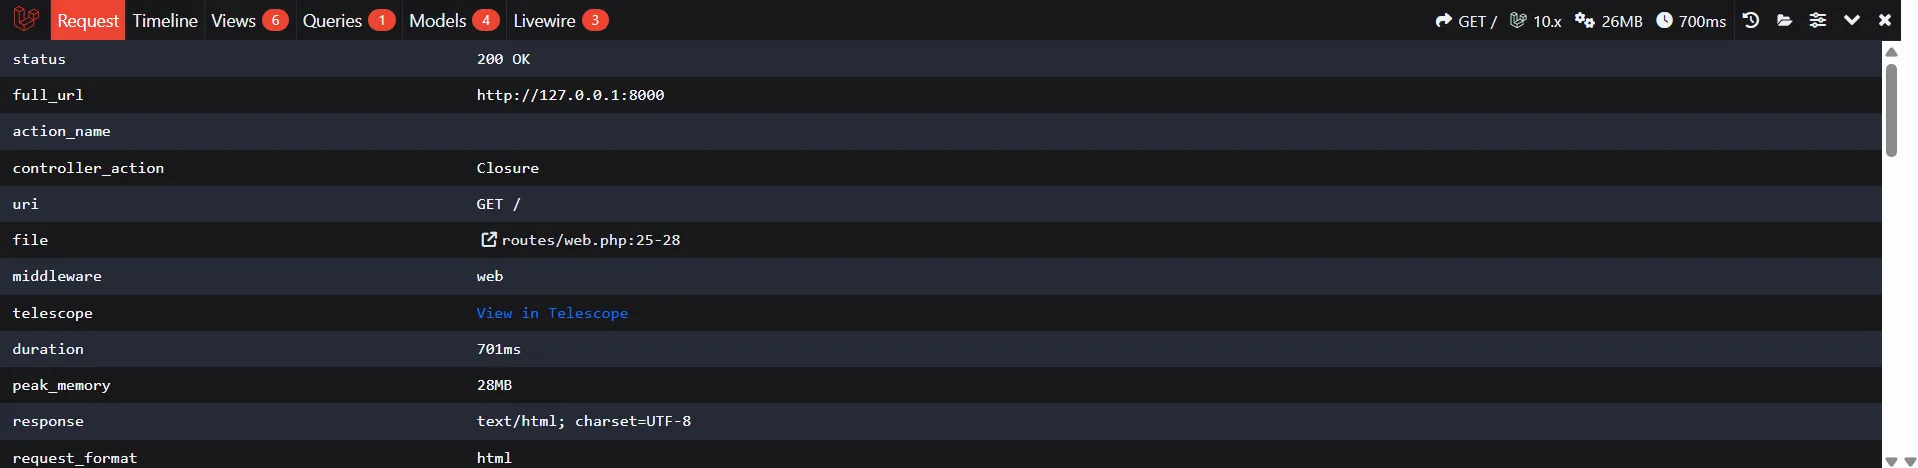
The Route tab shows comprehensive routing information:
- Current URI and HTTP method
- Controller and action
- Applied middleware
- Route parameters
- Named route
- Route file path
6. Request & Response Monitoring
View detailed information about the HTTP request and response:
// In your controller or middleware
use Debugbar;

public function store(Request $request)
{
    // Log request data
    Debugbar::info('Request Data', $request->all());
    Debugbar::info('Request Headers', $request->headers->all());
    Debugbar::info('Session Data', $request->session()->all());

    $user = User::create($request->validated());

    // Log response data
    Debugbar::info('Created User', $user->toArray());

    return response()->json($user, 201);
}
7. Mail Debugging: Track Email Sending
The Mail tab captures all emails sent during the request, showing recipients, subject, and preview of content:
use App\Mail\WelcomeEmail;
use Illuminate\Support\Facades\Mail;
use Debugbar;

public function sendWelcome(User $user)
{
    Debugbar::startMeasure('send-email', 'Sending welcome email');

    Mail::to($user->email)->send(new WelcomeEmail($user));

    Debugbar::stopMeasure('send-email');
    Debugbar::info('Welcome email queued for: ' . $user->email);

    // Check Mail tab in Debugbar to see email details
}
8. AJAX & Previous Requests: Debug API Calls
One of the most underrated features - Debugbar stores previous requests (including AJAX and API calls), allowing you to inspect them after execution:
// In your JavaScript
fetch('/api/users')
    .then(response => response.json())
    .then(data => console.log(data));

// Open Debugbar, click the history icon
// View the AJAX request with:
// - Response time
// - Query count
// - Memory usage
// - Full request/response data
Configure AJAX capturing in config/debugbar.php:
'capture_ajax' => env('DEBUGBAR_CAPTURE_AJAX', true),
'add_ajax_timing' => true,
Advanced Laravel Debugbar Techniques
Custom Collectors: Extend Debugbar Functionality
Create custom data collectors for specific debugging needs:
use DebugBar\DataCollector\DataCollector;
use DebugBar\DataCollector\Renderable;

class CustomAPICollector extends DataCollector implements Renderable
{
    protected $apiCalls = [];

    public function addCall($endpoint, $duration, $response)
    {
        $this->apiCalls[] = [
            'endpoint' => $endpoint,
            'duration' => $duration,
            'response' => $response,
            'timestamp' => microtime(true)
        ];
    }

    public function collect()
    {
        return [
            'count' => count($this->apiCalls),
            'calls' => $this->apiCalls
        ];
    }

    public function getName()
    {
        return 'custom_api';
    }

    public function getWidgets()
    {
        return [
            'custom_api' => [
                'icon' => 'globe',
                'widget' => 'PhpDebugBar.Widgets.VariableListWidget',
                'map' => 'custom_api.calls',
                'default' => '{}'
            ]
        ];
    }
}

// Register in AppServiceProvider
use Debugbar;

public function boot()
{
    Debugbar::addCollector(new CustomAPICollector());
}
Conditional Debugging: Enable for Specific Users
Enable Debugbar only for specific users (e.g., admins) in production:
// In AppServiceProvider or middleware
use Debugbar;
use Illuminate\Support\Facades\Auth;

public function boot()
{
    if (app()->environment('production')) {
        // Only enable for admin users
        Debugbar::disable();

        if (Auth::check() && Auth::user()->isAdmin()) {
            Debugbar::enable();
        }
    }
}

// Or in .env based on IP
if (in_array(request()->ip(), ['127.0.0.1', '192.168.1.100'])) {
    Debugbar::enable();
}
Performance Profiling: Deep Dive Analysis
use Debugbar;

public function complexOperation()
{
    Debugbar::startMeasure('total', 'Total Operation Time');

    // Database operations
    Debugbar::startMeasure('db-fetch', 'Fetch Users');
    $users = User::with('roles', 'permissions')->get();
    Debugbar::stopMeasure('db-fetch');

    // Processing
    Debugbar::startMeasure('process', 'Process Users');
    $processed = $users->map(function($user) {
        return [
            'id' => $user->id,
            'name' => $user->name,
            'can_edit' => $user->hasPermission('edit'),
        ];
    });
    Debugbar::stopMeasure('process');

    // Cache storage
    Debugbar::startMeasure('cache', 'Store in Cache');
    Cache::put('processed_users', $processed, 3600);
    Debugbar::stopMeasure('cache');

    Debugbar::stopMeasure('total');

    return $processed;
}
Disabling Laravel Debugbar in Production: Security Best Practices
Never run Debugbar in production! It exposes sensitive information including database credentials, environment variables, and application structure. Here are multiple ways to ensure it's disabled:
Method 1: Environment Variables (.env)
# Production .env file
APP_ENV=production
APP_DEBUG=false
DEBUGBAR_ENABLED=false
Method 2: Configuration File
Edit config/debugbar.php:
'enabled' => env('DEBUGBAR_ENABLED', env('APP_DEBUG', false)),

// Or more restrictive
'enabled' => env('APP_ENV') === 'local' && env('APP_DEBUG', false),
Method 3: Composer Optimization
Since Debugbar is installed with --dev, exclude dev dependencies in production:
composer install --no-dev --optimize-autoloaderMethod 4: Runtime Disabling
// In AppServiceProvider boot method
if (app()->environment('production')) {
    \Debugbar::disable();
}

// Or in middleware
if (!app()->environment('local')) {
    config(['debugbar.enabled' => false]);
}
🚨 Critical Security Warning:
Debugbar exposes: SQL queries (including sensitive data), environment variables, session data, user information, file paths, and configuration. Always verify it's disabled before deploying to production!
Query Optimization with Debugbar: Solving Common Performance Issues
Detecting and Fixing N+1 Query Problems
The most common Laravel performance issue - here's how to identify and fix it:
// ❌ BAD: N+1 Problem (1 + N queries)
// Debugbar will show: 1 query + 100 additional queries if you have 100 posts
$posts = Post::all(); // 1 query

foreach ($posts as $post) {
    echo $post->user->name; // N queries (one per post)
    echo $post->category->name; // N more queries
}
// Total: 201 queries! 🐌

// ✅ GOOD: Eager Loading (3 queries only)
$posts = Post::with(['user', 'category'])->get(); // 3 queries total

foreach ($posts as $post) {
    echo $post->user->name; // No additional query
    echo $post->category->name; // No additional query
}
// Total: 3 queries! 🚀

// ✅ BETTER: Selective eager loading with conditions
$posts = Post::with([
    'user:id,name,email', // Only load specific columns
    'category',
    'tags' => function($query) {
        $query->where('active', true);
    }
])->get();

// ✅ BEST: Use lazy eager loading when needed conditionally
$posts = Post::all();

if ($needsAuthors) {
    $posts->load('user');
}

if ($needsComments) {
    $posts->load(['comments' => function($query) {
        $query->with('user')->latest()->limit(5);
    }]);
}
Optimizing Slow Queries
Use Debugbar to identify slow queries (highlighted in red when > 500ms):
// ❌ Slow query without index
$users = User::where('email', 'like', '%@example.com')->get();
// Debugbar shows: 2.5s execution time

// ✅ Add database index
// In migration:
Schema::table('users', function (Blueprint $table) {
    $table->index('email');
});

// ✅ Optimize query with specific columns
$users = User::where('email', 'like', '%@example.com')
             ->select('id', 'name', 'email')
             ->get();
// Debugbar shows: 0.15s execution time

// ✅ Use full-text search for better performance
Schema::table('posts', function (Blueprint $table) {
    $table->fullText(['title', 'content']);
});

$posts = Post::whereFullText(['title', 'content'], 'laravel debugging')->get();
Reducing Query Count
// ❌ Multiple separate queries
$activeUsers = User::where('active', true)->count(); // Query 1
$inactiveUsers = User::where('active', false)->count(); // Query 2
$totalUsers = User::count(); // Query 3

// ✅ Single query with grouping
$userStats = User::selectRaw('
    COUNT(*) as total,
    SUM(CASE WHEN active = 1 THEN 1 ELSE 0 END) as active,
    SUM(CASE WHEN active = 0 THEN 1 ELSE 0 END) as inactive
')->first();

// ✅ Use subqueries
$users = User::select('users.*')
    ->selectSub(
        Post::selectRaw('count(*)')
            ->whereColumn('user_id', 'users.id'),
        'posts_count'
    )
    ->get();
Best Practices: Maximizing Laravel Debugbar Efficiency
1. Environment-Specific Configuration
- ✅ Only enable in
localanddevelopmentenvironments - ✅ Use
--devflag during installation - ✅ Verify disabled status before production deployment
- ✅ Never commit
APP_DEBUG=trueto production .env
2. Query Monitoring Strategy
- ✅ Monitor query execution time - aim for under 100ms per query
- ✅ Watch for duplicate queries indicating missing eager loading
- ✅ Check for N+1 issues on every new feature
- ✅ Use
DB::enableQueryLog()for detailed analysis - ✅ Set up query count alerts for pages (target < 20 queries)
3. Timeline Analysis
- ✅ Measure critical operations with custom timers
- ✅ Identify bottlenecks taking > 30% of total request time
- ✅ Monitor view rendering performance
- ✅ Track middleware execution time
4. AJAX & API Debugging
- ✅ Enable AJAX request capturing
- ✅ Review previous requests for API endpoint optimization
- ✅ Monitor API response times and query counts
- ✅ Check session data for SPA authentication issues
5. View Optimization
- ✅ Check what data is passed to views - avoid over-fetching
- ✅ Monitor Blade compilation and rendering time
- ✅ Identify unused view data
- ✅ Optimize view composers
6. Memory Management
- ✅ Monitor memory usage in Messages tab
- ✅ Look for memory leaks in loops
- ✅ Use
chunk()for large dataset processing - ✅ Check peak memory usage for resource-intensive operations
7. Custom Logging
- ✅ Use
Debugbar::info()for important checkpoints - ✅ Add context with
Debugbar::warning()for edge cases - ✅ Log complex data structures for inspection
- ✅ Remove debug statements before committing code
Troubleshooting Common Laravel Debugbar Issues
Debugbar Not Showing
Problem:
Debugbar toolbar doesn't appear on the page
Solutions:
// 1. Check .env configuration
APP_DEBUG=true
DEBUGBAR_ENABLED=true

// 2. Clear config cache
php artisan config:clear
php artisan cache:clear

// 3. Verify installation
composer show barryvdh/laravel-debugbar

// 4. Check if page has closing </body> tag
// Debugbar injects before </body>

// 5. Force enable in code
// In AppServiceProvider
\Debugbar::enable();

// 6. Check browser console for JavaScript errors
AJAX Requests Not Captured
// In config/debugbar.php
'capture_ajax' => true,
'add_ajax_timing' => true,

// Make sure AJAX requests accept HTML
fetch('/api/endpoint', {
    headers: {
        'X-Requested-With': 'XMLHttpRequest'
    }
});
Performance Impact on Development
If Debugbar slows down your development environment:
// In config/debugbar.php
'collectors' => [
    'phpinfo' => false,  // Disable if not needed
    'messages' => true,
    'time' => true,
    'memory' => true,
    'exceptions' => true,
    'log' => false,  // Disable if too verbose
    'db' => true,
    'views' => true,
    'route' => true,
    'auth' => false,  // Disable if not needed
    'gate' => false,
    'session' => false,
    'symfony_request' => false,
    'mail' => true,
    'laravel' => true,
    'events' => false,  // Can be heavy
    'default_request' => true,
    'logs' => false,
    'files' => false,
    'config' => false,
    'cache' => false,
],
Laravel Debugbar Alternatives and Complementary Tools
While Laravel Debugbar is excellent, consider these complementary or alternative tools:
🔍 Laravel Telescope
Best for: Production monitoring, request history, job tracking
More powerful than Debugbar for tracking requests over time, monitoring queues, and analyzing application behavior patterns.
composer require laravel/telescope
php artisan telescope:install
php artisan migrate
⚡ Clockwork
Best for: Browser extension debugging, cleaner UI
Similar to Debugbar but with a Chrome extension, keeping debugging data separate from your application UI.
composer require itsgoingd/clockwork🐛 Ray by Spatie
Best for: Desktop debugging, advanced data inspection
Desktop application for debugging with beautiful UI, great for complex data structures and real-time debugging.
composer require spatie/laravel-ray📊 Laravel Pulse
Best for: Application performance metrics, real-time monitoring
Official Laravel package for monitoring application performance, queue jobs, and server metrics in production.
composer require laravel/pulse
php artisan pulse:install
Conclusion: Master Laravel Debugging for Better Applications
Laravel Debugbar is an indispensable tool for every Laravel developer, providing comprehensive insights into application performance, database queries, and execution flow. By mastering its features - from query optimization and N+1 problem detection totimeline analysis and AJAX debugging - you can significantly improve your development workflow and build faster, more efficient Laravel applications.
Key takeaways:
- ✅ Install Debugbar in every Laravel project (development only)
- ✅ Monitor query counts and execution times religiously
- ✅ Use eager loading to solve N+1 problems
- ✅ Profile critical operations with custom measurements
- ✅ Never enable in production environments
- ✅ Combine with Laravel Telescope for comprehensive monitoring
Whether you're building a small project or a large-scale enterprise application, Laravel Debugbar's real-time debugging capabilities will help you identify bottlenecks, optimize database queries, and deliver high-performance applications. Start using it today and experience the difference in your Laravel development efficiency!
Frequently Asked Questions About Laravel Debugbar
Related Articles You May Like
- Top Coding Tips: Clean Code, Boost Productivity, Master Practices
Best Practices • Intermediate
- The Ultimate Guide to Code Debugging: Techniques, Tools & Tips
Debugging • Intermediate
- GitHub Actions: Complete CI/CD Automation Guide
Git • Intermediate
- Laravel API Example: Creating Efficient Endpoints
Laravel • Advanced
- Laravel Tips and Tricks: Hidden Features Most Developers Miss
Laravel • Advanced
- How to Debug Laravel SQL Queries in API Requests: A Developer's Guide
Laravel • Intermediate